Views: Large, Multipurpose Datasets
Executive Summary
I spearheaded a project aimed at redesigning the display of large and varied datasets to address user frustrations with confusing and inflexible data table settings. Utilizing a Lean UX-inspired methodology, we conducted evaluative research and design refinement to develop a solution that caters to diverse user needs.
Currently in the Open Beta phase, the new and improved UX has been well-received by change-averse users and is set to launch after a final round of enhancements.
Evaluative research revealed a 76% success rate among participants in achieving a desirable layout on their first try, highlighting the efficacy of the new Views feature. Positive user feedback underscores the utility and helpfulness of the improvements, indicating a significant enhancement to user experience.
Everything I can think of is already an option
Problem
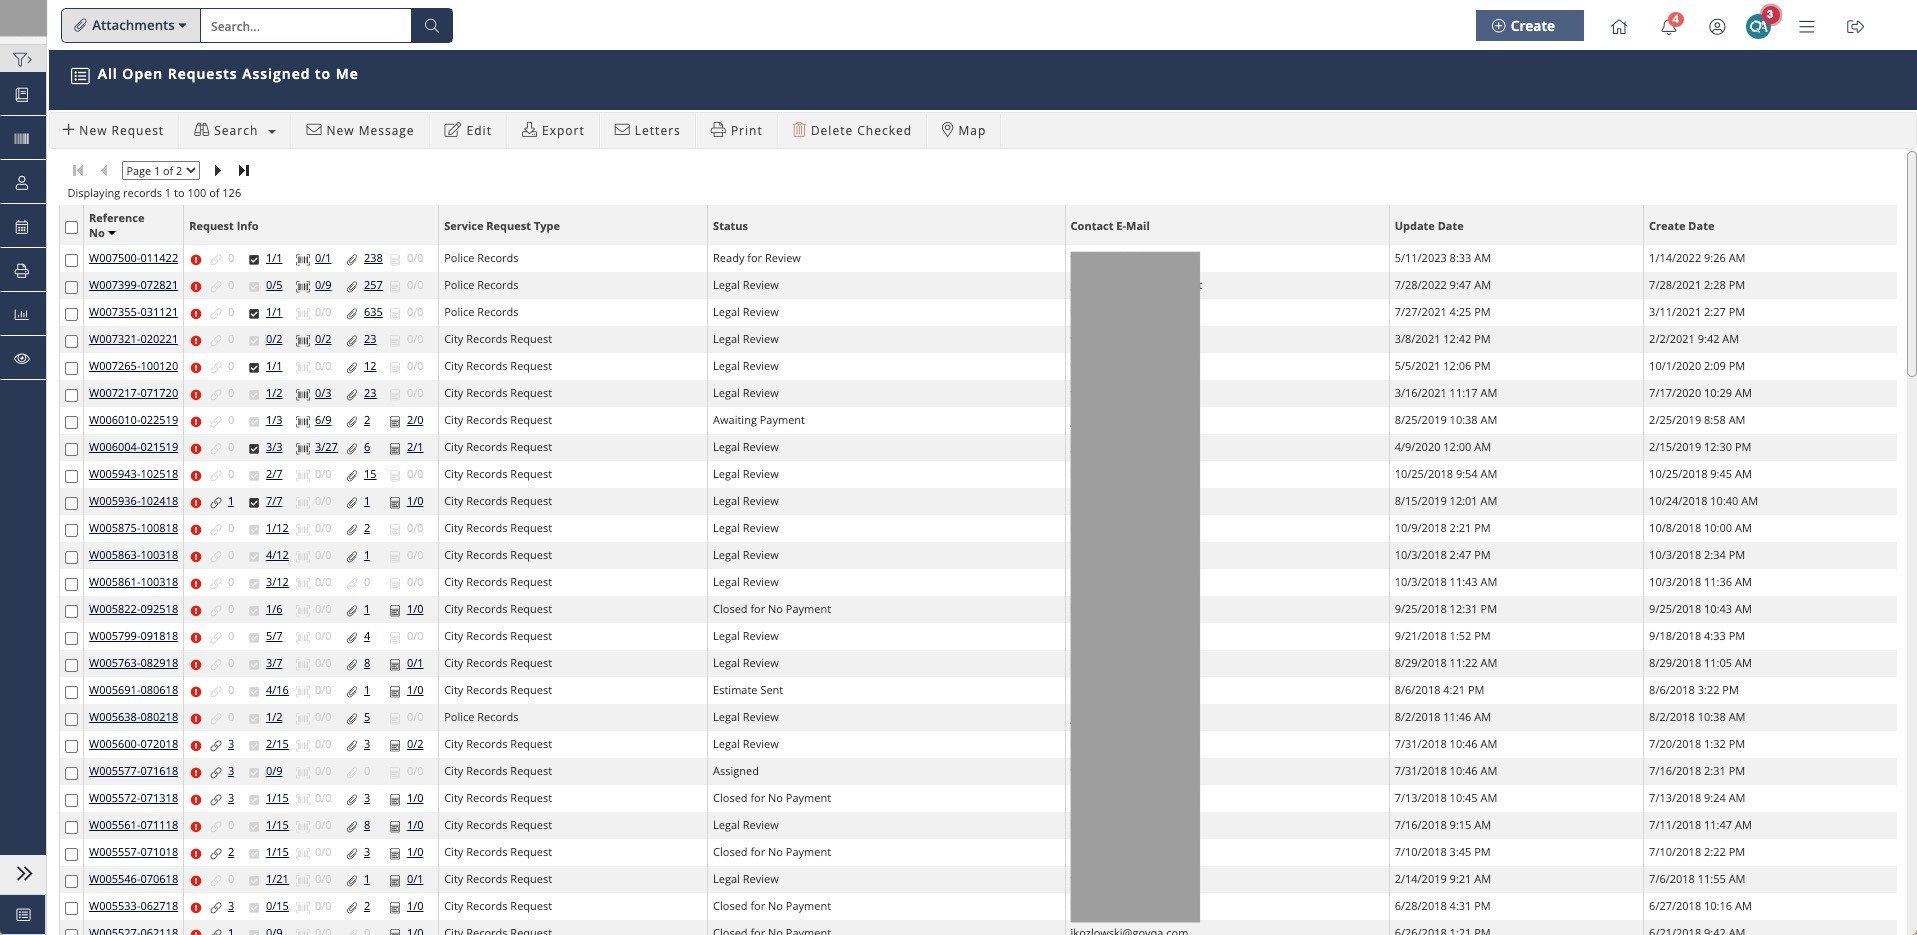
Data table settings were confusing, inflexible, and did not support all users in being able to see data in the way they want to see it. While designing a new data table experience, we found it worked well in concept and for novice users, but in practical application for experienced users, but the new and improved UX was problematic for existing users because the change of layout was perceived as requiring more work to adapt, without equivalent reward.
My Role
Generative Phase: Lead UX Researcher, Lead Designer
Evaluative Phase: Manager of UX Researcher, Lead Designer
Process
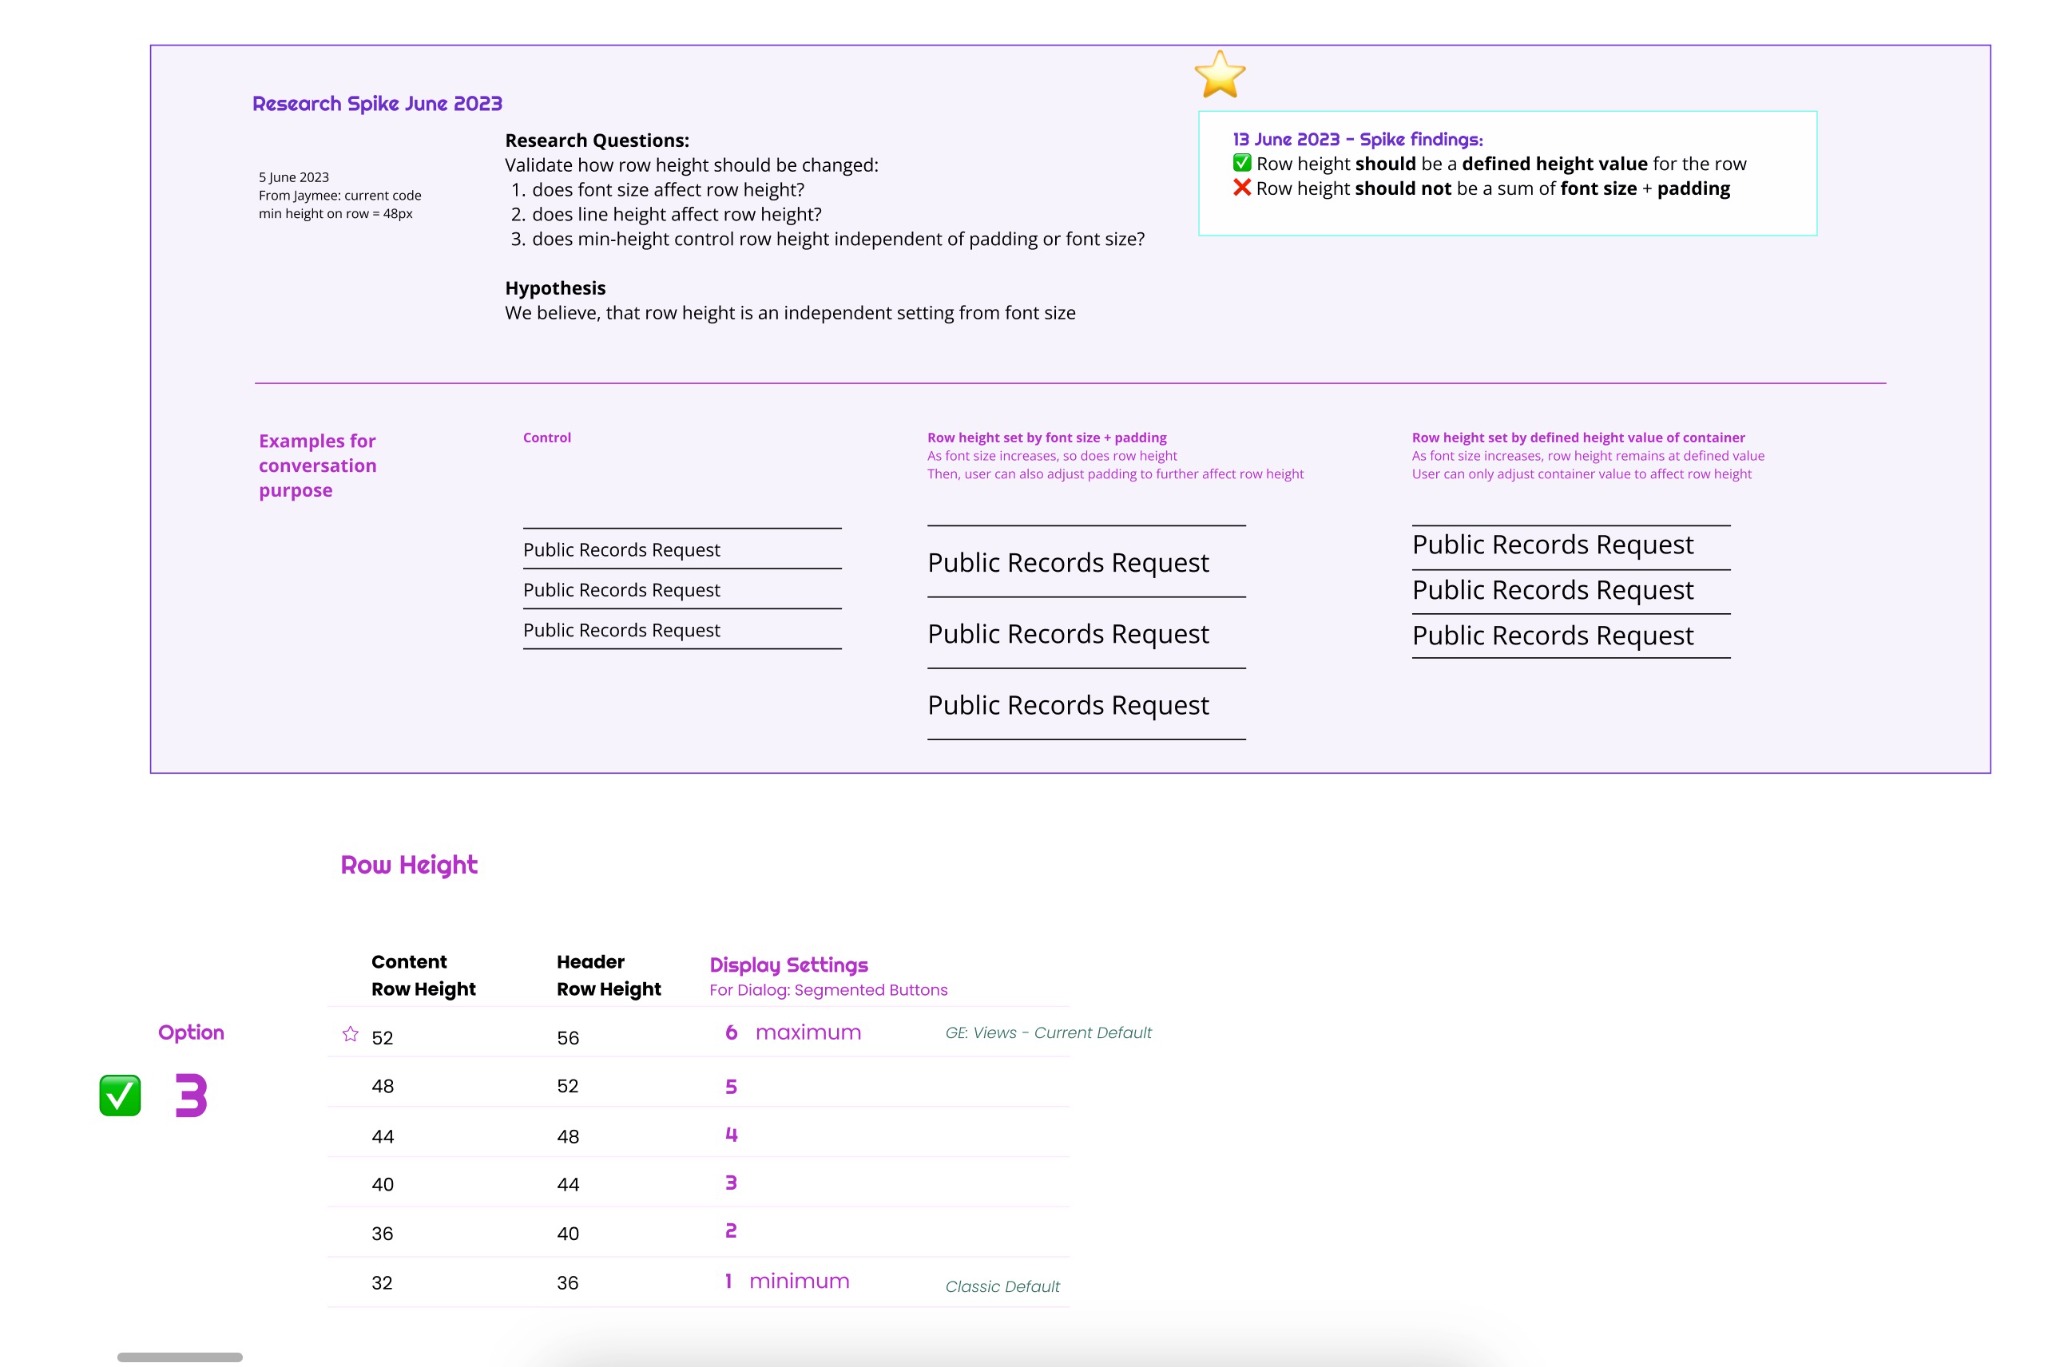
- Identify the flaw in prior attempts and designed a new tactical approach
- Partner with Engineering to build a high-fidelity prototype to allow participants to react within their own environments and datasets
- Test our hypothesis on a refined cohort: a unique change-averse mindset within an existing User Persona
- Apply Lean UX-inspired methodology
- Conduct evaluative research: Unmoderated exercise and survey to collect qual and quant data
- Present findings and recommendations to Product Management partners to align on scope for next phase
- Refine designs based on prioritized decisions
Solution
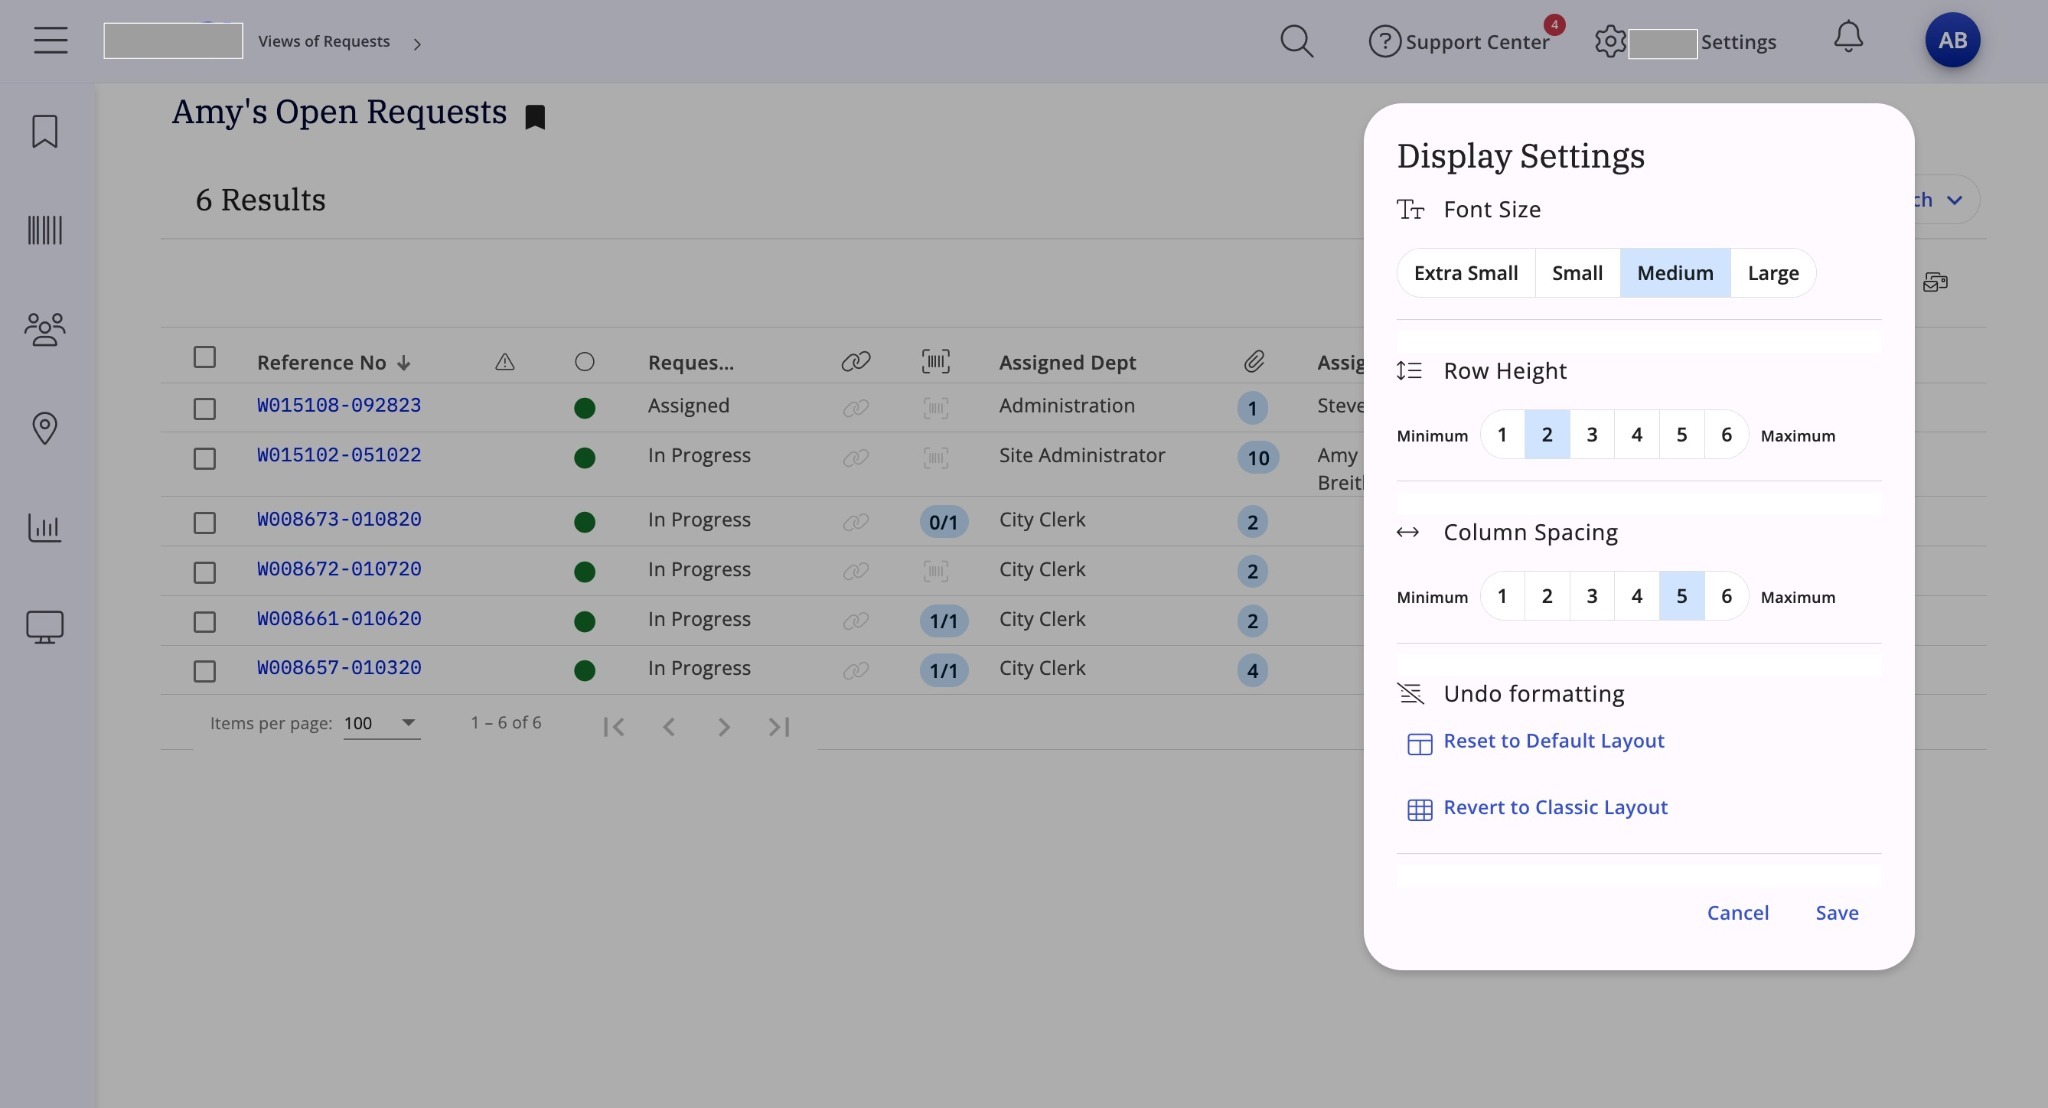
I introduced a multifaceted solution for displaying large datasets. This included a 'display settings' dialog for user customization, a new default layout for experienced users mirroring the old design, and user-level WYSIWYG options for font size, padding, column visibility, and position.
As this was a final phase in a wide-impact project, these strategic interventions provided enhanced customization options and ensuring a seamless transition to the new interface for experienced power users with change-averse mindsets.
Impact
Through evaluative research, we sought to determine if users accustomed to the old Views could effectively navigate and interpret data. The findings revealed that 76% of participants achieved a desirable layout on their first attempt.
Additionally, this study uncovered a compounding issue caused by another feature, which negatively impacted the success of the new Views, which allowed us to proactively remedy the otherwise unrelated feature to reduce its negative impact on Views.
The new Display Settings Editor exceeded our success threshold to move forward to the Open Beta phase. On a scale of 1 to 5 with 1 being strongly agree and 5 being strongly disagree, the current iteration was deemed as easy to use (with a score of 3.82), and the new Views were perceived as helpful for users' work (with a score of 3.39).
Overall, these insights underscored the effectiveness of the new Views solution in meeting user needs and improving efficiency, despite initial challenges with user adoption.
I'll need to use it for awhile, but the new changes seem extremely helpful.
Post a comment